4.1Pandas介绍
学习目标
- 目标
- 了解Numpy与Pandas的不同
- 了解Pandas的MultiIndex与panel结构
- 说明Pandas的Series与Dataframe两种结构的区别
- 应用
- 股票涨跌幅数据的修改
4.1.1 Pandas介绍
- 2008年WesMcKinney开发出的库
- 专门用于数据挖掘的开源python库
- 以Numpy为基础,借力Numpy模块在计算方面性能高的优势
- 基于matplotlib,能够简便的画图
- 独特的数据结构
4.1.2 为什么使用Pandas
Numpy已经能够帮助我们处理数据,能够结合matplotlib解决部分数据展示等问题,那么pandas学习的目的在什么地方呢?
- 便捷的数据处理能力
- 读取文件方便
- 封装了Matplotlib、Numpy的画图和计算
4.1.3 案例:
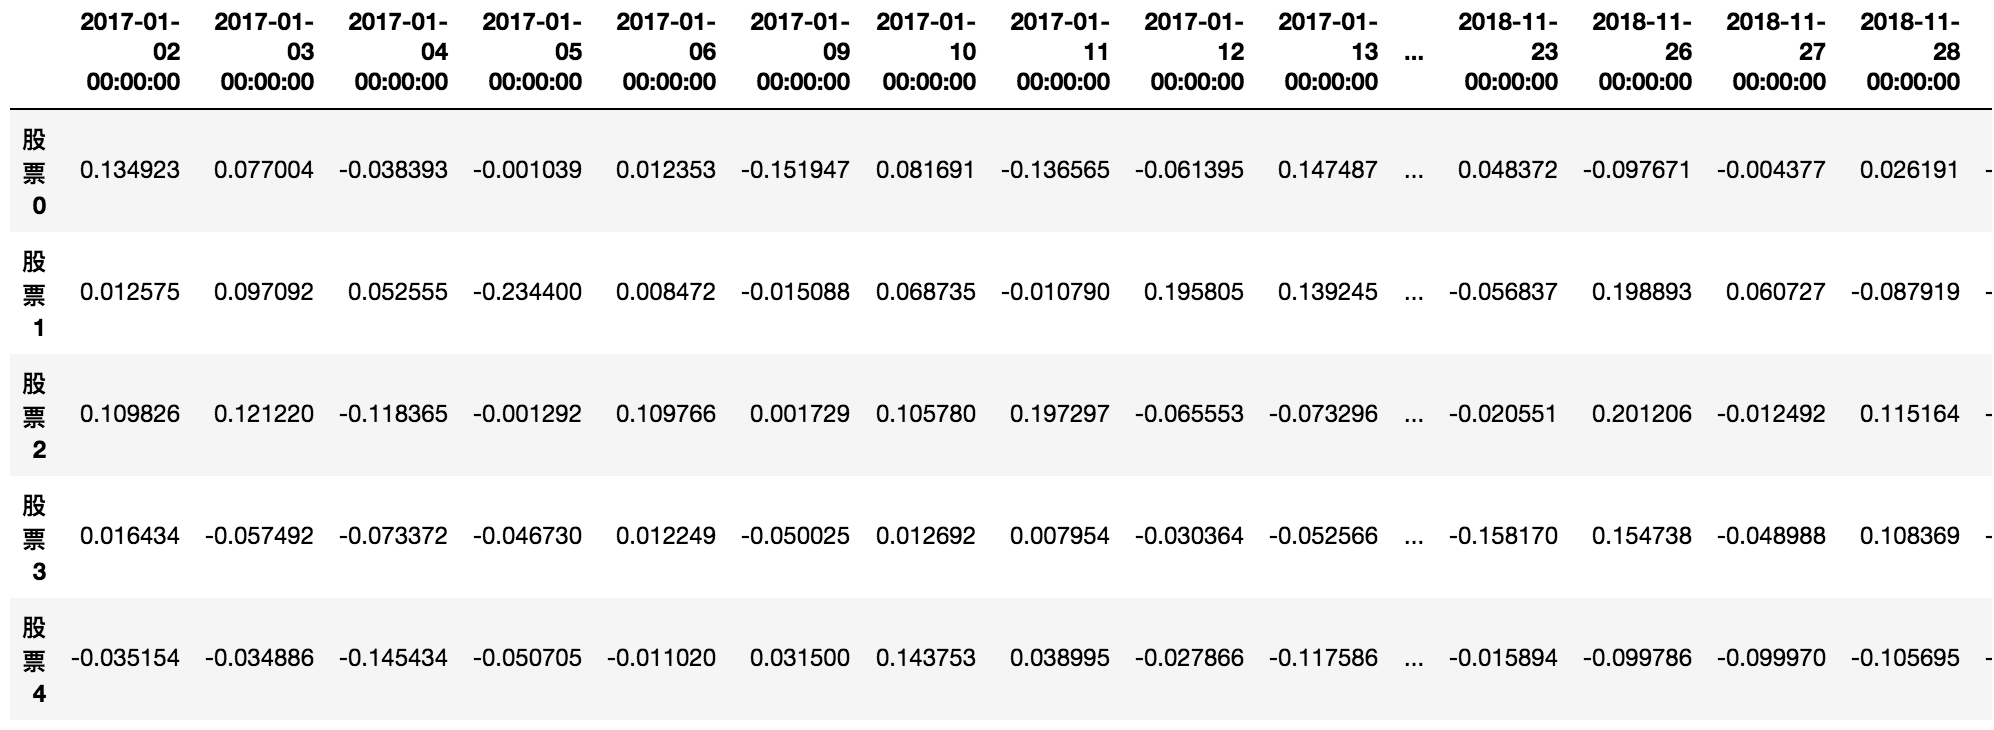
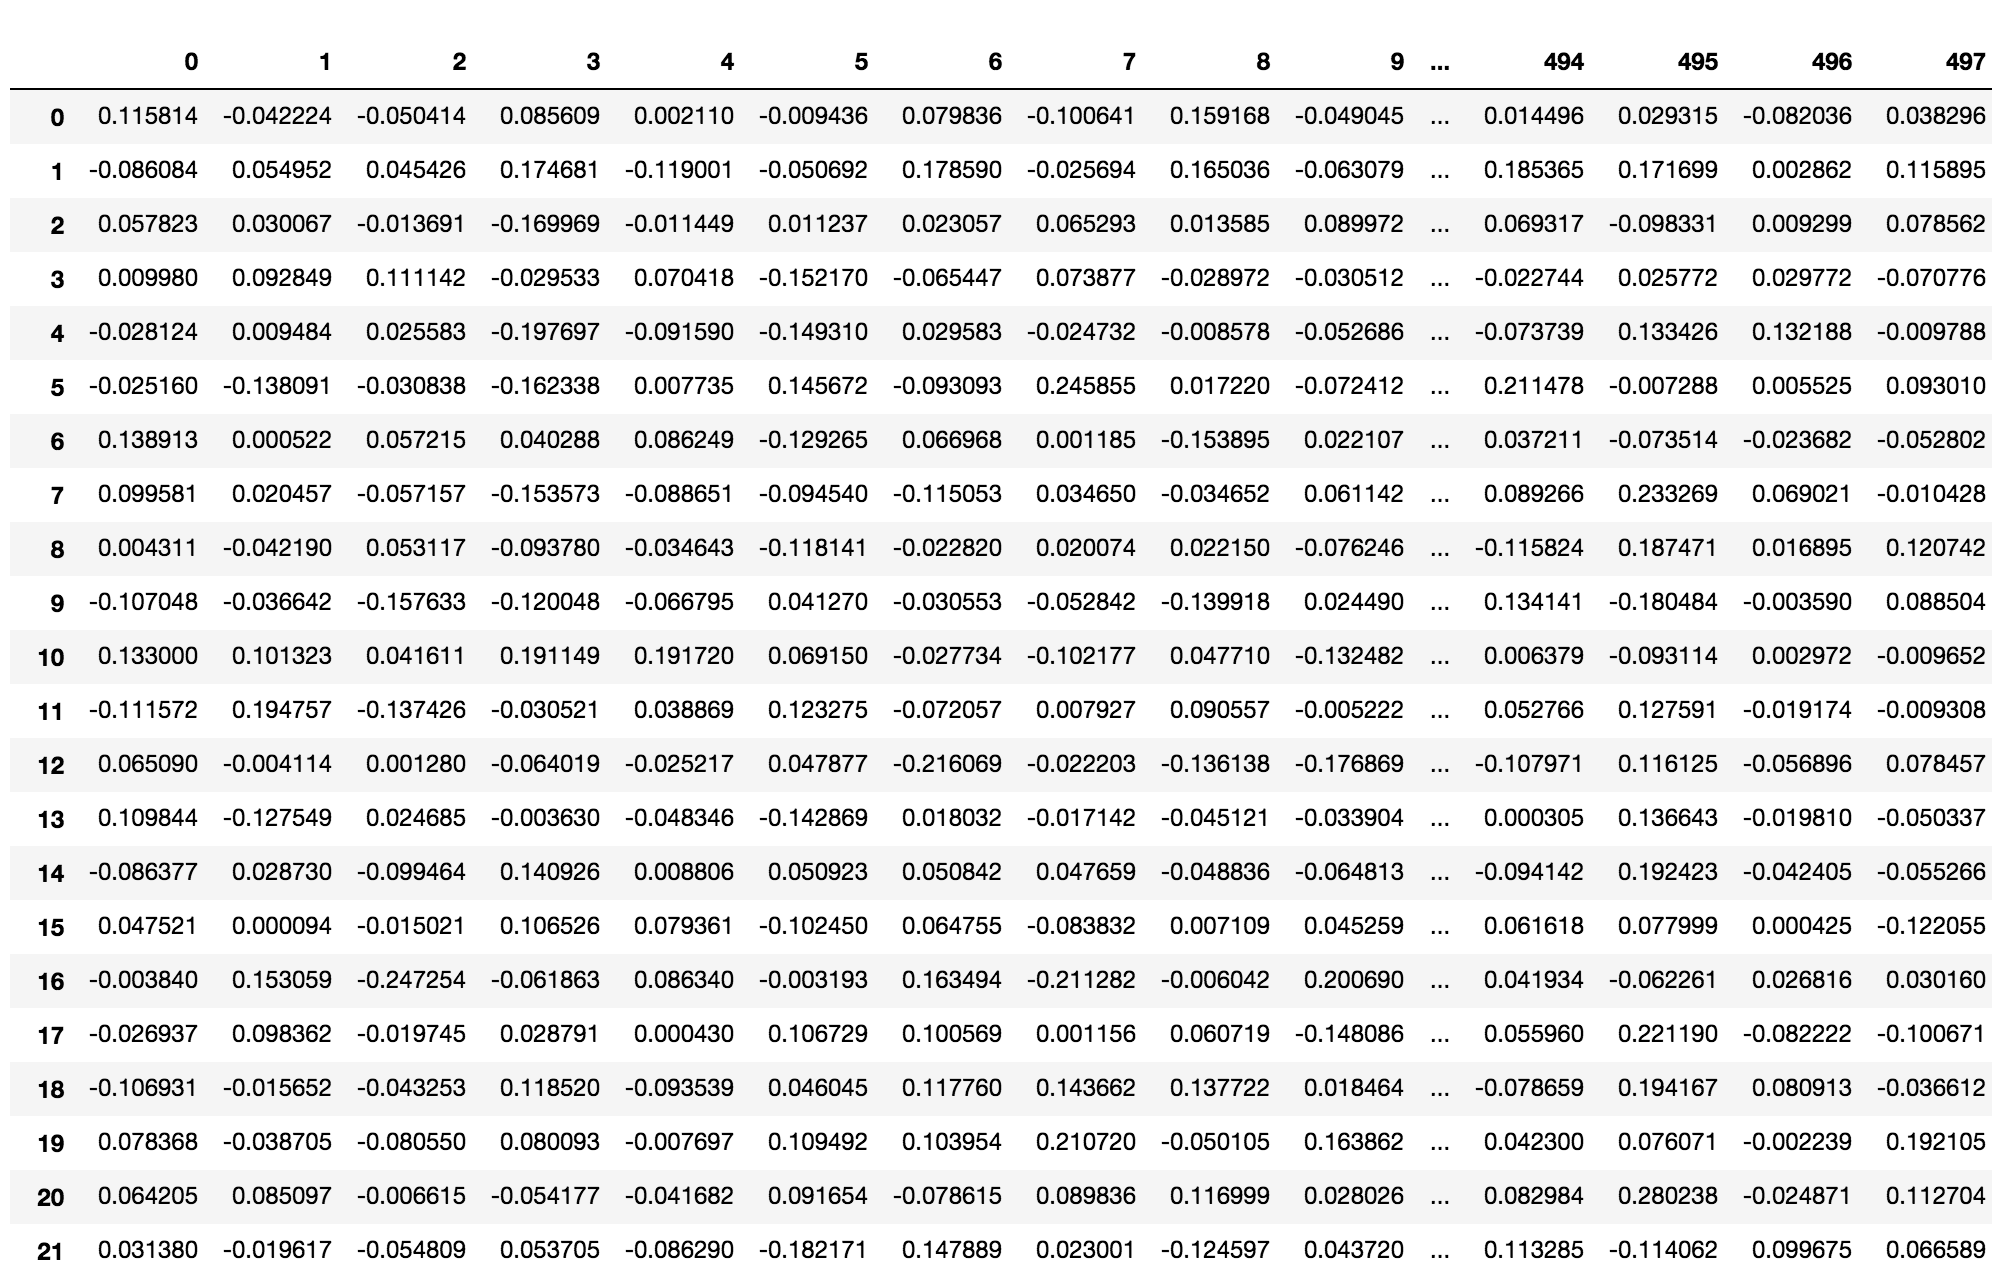
回忆我们在numpy当中创建的股票涨跌幅数据形式?
# 创建一个符合正太分布的10个股票5天的涨跌幅数据
stock_day_rise = np.random.normal(0, 1, (10, 5))

array([[-0.06544031, -1.30931491, -1.45451514,  0.57973008,  1.48602405],
       [-1.73216741, -0.83413717,  0.45861517, -0.80391793, -0.46878575],
       [ 0.21805567,  0.19901371,  0.7134683 ,  0.5484263 ,  0.38623412],
       [-0.42207879, -0.33702398,  0.42328531, -1.23079202,  1.32843773],
       [-1.72530711,  0.07591832, -1.91708358, -0.16535818,  1.07645091],
       [-0.81576845, -0.28675278,  1.20441981,  0.73365951, -0.06214496],
       [-0.98820861, -1.01815231, -0.95417342, -0.81538991,  0.50268175],
       [-0.10034128,  0.61196204, -0.06850331,  0.74738433,  0.143011  ],
       [ 1.00026175,  0.34241958, -2.2529711 ,  0.93921064,  1.14080312],
       [ 2.52064693,  1.55384756,  1.72252984,  0.61270132,  0.60888092]])
但是这样的数据形式很难看到存储的是什么的样的数据,并也很难获取相应的数据,比如需要获取某个指定股票的数据,就很难去获取!!
问题:如何让数据更有意义的显示?处理刚才的股票数据
# 使用Pandas中的数据结构
stock_day_rise = pd.DataFrame(stock_day_rise)
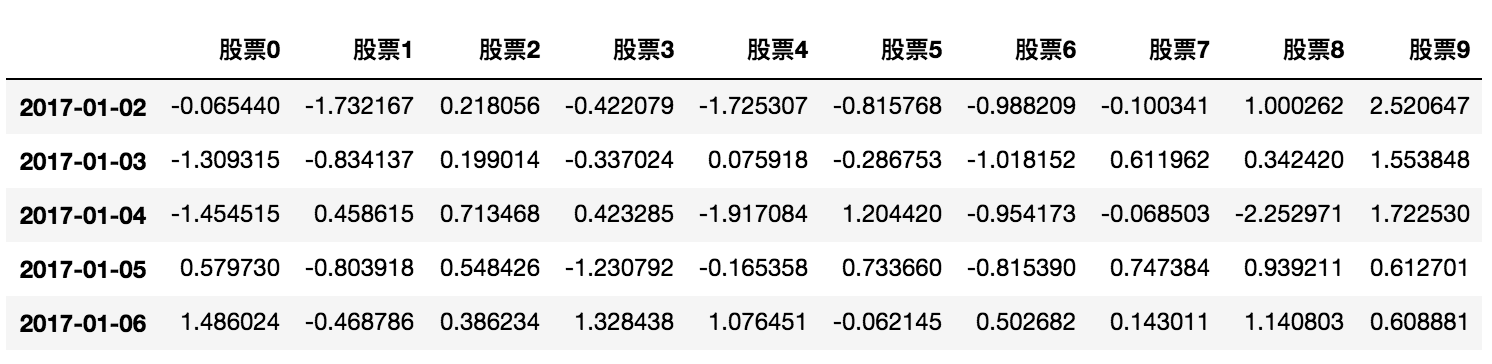
给股票涨跌幅数据增加行列索引,显示效果更佳
效果:
- 增加行索引
# 构造行索引序列
stock_code = ['股票' + str(i) for i in range(stock_day_rise.shape[0])]

# 添加行索引
data = pd.DataFrame(stock_day_rise, index=stock_code)
- 增加列索引
股票的日期是一个时间的序列,我们要实现从前往后的时间还要考虑每月的总天数等,不方便。使用pd.date_range():用于生成一组连续的时间序列(暂时了解)
date_range(start=None,end=None, periods=None, freq='B')

    start:开始时间

    end:结束时间

    periods:时间天数

    freq:递进单位,默认1天,'B'默认略过周末
# 生成一个时间的序列,略过周末非交易日
date = pd.date_range('2017-01-01', periods=stock_day_rise.shape[1], freq='B')

# index代表行索引,columns代表列索引
data = pd.DataFrame(stock_day_rise, index=stock_index, columns=date)
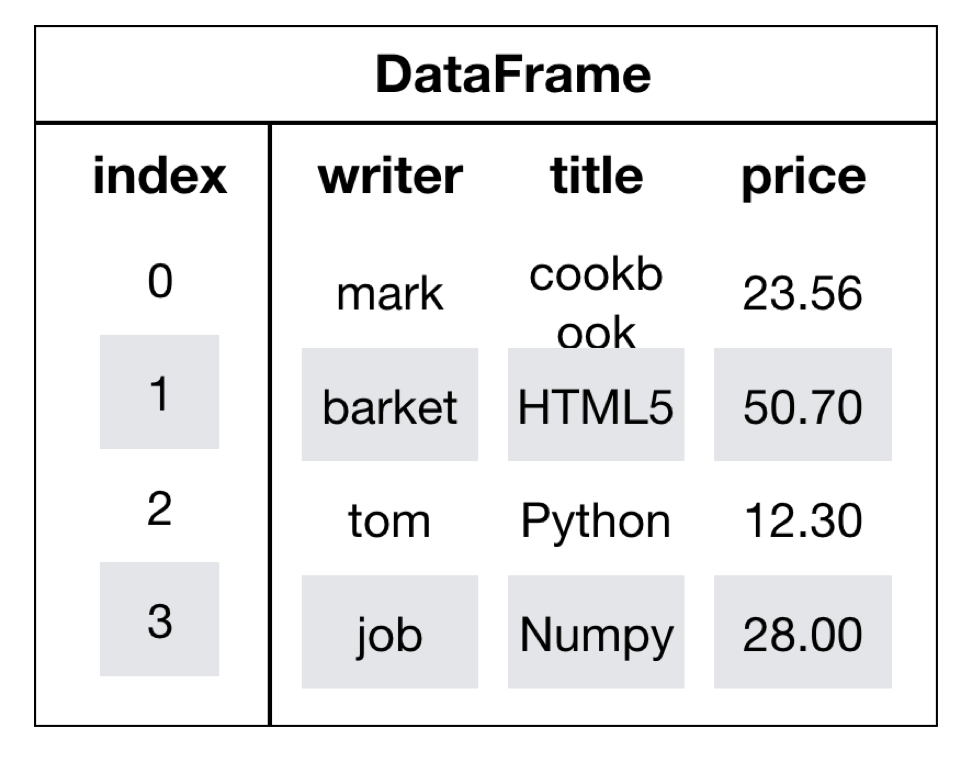
4.1.4 DataFrame
4.1.4.1 DataFrame结构
DataFrame对象既有行索引,又有列索引
- 行索引,表明不同行,横向索引,叫index,0轴,axis=0
- 列索引,表名不同列,纵向索引,叫columns,1轴,axis=1
4.1.4.2 DatatFrame的属性
- shape
data.shape
# 结果
(10, 5)
- index
DataFrame的行索引列表
data.index

Index(['股票0', '股票1', '股票2', '股票3', '股票4', '股票5', '股票6', '股票7', '股票8', '股票9'], dtype='object')
- columns
DataFrame的列索引列表
data.columns

DatetimeIndex(['2017-01-02', '2017-01-03', '2017-01-04', '2017-01-05',
               '2017-01-06'],
              dtype='datetime64[ns]', freq='B')
- values
直接获取其中array的值
data.values

array([[-0.06544031, -1.30931491, -1.45451514,  0.57973008,  1.48602405],
       [-1.73216741, -0.83413717,  0.45861517, -0.80391793, -0.46878575],
       [ 0.21805567,  0.19901371,  0.7134683 ,  0.5484263 ,  0.38623412],
       [-0.42207879, -0.33702398,  0.42328531, -1.23079202,  1.32843773],
       [-1.72530711,  0.07591832, -1.91708358, -0.16535818,  1.07645091],
       [-0.81576845, -0.28675278,  1.20441981,  0.73365951, -0.06214496],
       [-0.98820861, -1.01815231, -0.95417342, -0.81538991,  0.50268175],
       [-0.10034128,  0.61196204, -0.06850331,  0.74738433,  0.143011  ],
       [ 1.00026175,  0.34241958, -2.2529711 ,  0.93921064,  1.14080312],
       [ 2.52064693,  1.55384756,  1.72252984,  0.61270132,  0.60888092]])
- T
转置
data.T
结果
- head(5):显示前5行内容
如果不补充参数,默认5行。填入参数N则显示前N行
data.head(5)

2017-01-02 00:00:00    2017-01-03 00:00:00    2017-01-04 00:00:00    2017-01-05 00:00:00    2017-01-06 00:00:00
股票0    -0.065440    -1.309315    -1.454515    0.579730    1.486024
股票1    -1.732167    -0.834137    0.458615    -0.803918    -0.468786
股票2    0.218056    0.199014    0.713468    0.548426    0.386234
股票3    -0.422079    -0.337024    0.423285    -1.230792    1.328438
股票4    -1.725307    0.075918    -1.917084    -0.165358    1.076451
- tail(5):显示后5行内容
如果不补充参数,默认5行。填入参数N则显示后N行
data.tail(5)

 2017-01-02 00:00:00    2017-01-03 00:00:00    2017-01-04 00:00:00    2017-01-05 00:00:00    2017-01-06 00:00:00
股票5    -0.815768    -0.286753    1.204420    0.733660    -0.062145
股票6    -0.988209    -1.018152    -0.954173    -0.815390    0.502682
股票7    -0.100341    0.611962    -0.068503    0.747384    0.143011
股票8    1.000262    0.342420    -2.252971    0.939211    1.140803
股票9    2.520647    1.553848    1.722530    0.612701    0.608881
4.1.4.3 DatatFrame索引的设置
- 修改行列索引值
stock_code = ["股票_" + str(i) for i in range(stock_day_rise.shape[0])]

# 必须整体全部修改
data.index = stock_code
结果
2017-01-02 00:00:00    2017-01-03 00:00:00    2017-01-04 00:00:00    2017-01-05 00:00:00    2017-01-06 00:00:00
股票_0    -0.065440    -1.309315    -1.454515    0.579730    1.486024
股票_1    -1.732167    -0.834137    0.458615    -0.803918    -0.468786
股票_2    0.218056    0.199014    0.713468    0.548426    0.386234
股票_3    -0.422079    -0.337024    0.423285    -1.230792    1.328438
股票_4    -1.725307    0.075918    -1.917084    -0.165358    1.076451
股票_5    -0.815768    -0.286753    1.204420    0.733660    -0.062145
股票_6    -0.988209    -1.018152    -0.954173    -0.815390    0.502682
股票_7    -0.100341    0.611962    -0.068503    0.747384    0.143011
股票_8    1.000262    0.342420    -2.252971    0.939211    1.140803
股票_9    2.520647    1.553848    1.722530    0.612701    0.608881
注意:以下修改方式是错误的
# 错误修改方式
data.index[3] = '股票_3'
- 重设索引
- reset_index(drop=False)
- 设置新的下标索引
- drop:默认为False,不删除原来索引,如果为True,删除原来的索引值
- reset_index(drop=False)
# 重置索引,drop=False
data.reset_index()

    index    2017-01-02 00:00:00    2017-01-03 00:00:00    2017-01-04 00:00:00    2017-01-05 00:00:00    2017-01-06 00:00:00
0    股票_0    -0.065440    -1.309315    -1.454515    0.579730    1.486024
1    股票_1    -1.732167    -0.834137    0.458615    -0.803918    -0.468786
2    股票_2    0.218056    0.199014    0.713468    0.548426    0.386234
3    股票_3    -0.422079    -0.337024    0.423285    -1.230792    1.328438
4    股票_4    -1.725307    0.075918    -1.917084    -0.165358    1.076451
5    股票_5    -0.815768    -0.286753    1.204420    0.733660    -0.062145
6    股票_6    -0.988209    -1.018152    -0.954173    -0.815390    0.502682
7    股票_7    -0.100341    0.611962    -0.068503    0.747384    0.143011
8    股票_8    1.000262    0.342420    -2.252971    0.939211    1.140803
9    股票_9    2.520647    1.553848    1.722530    0.612701    0.608881
# 重置索引,drop=True
data.reset_index(drop=True)

2017-01-02 00:00:00    2017-01-03 00:00:00    2017-01-04 00:00:00    2017-01-05 00:00:00    2017-01-06 00:00:00
0    -0.065440    -1.309315    -1.454515    0.579730    1.486024
1    -1.732167    -0.834137    0.458615    -0.803918    -0.468786
2    0.218056    0.199014    0.713468    0.548426    0.386234
3    -0.422079    -0.337024    0.423285    -1.230792    1.328438
4    -1.725307    0.075918    -1.917084    -0.165358    1.076451
5    -0.815768    -0.286753    1.204420    0.733660    -0.062145
6    -0.988209    -1.018152    -0.954173    -0.815390    0.502682
7    -0.100341    0.611962    -0.068503    0.747384    0.143011
8    1.000262    0.342420    -2.252971    0.939211    1.140803
9    2.520647    1.553848    1.722530    0.612701    0.608881
- 以某列值设置为新的索引
- set_index(keys, drop=True)
- keys : 列索引名成或者列索引名称的列表
- drop : boolean, default True.当做新的索引,删除原来的列
- set_index(keys, drop=True)
设置新索引案例
- 1、创建
df = pd.DataFrame({'month': [1, 4, 7, 10],
                    'year': [2012, 2014, 2013, 2014],
                    'sale':[55, 40, 84, 31]})

   month  sale  year
0  1      55    2012
1  4      40    2014
2  7      84    2013
3  10     31    2014
- 2、以月份设置新的索引
df.set_index('month')
       sale  year
month
1      55    2012
4      40    2014
7      84    2013
10     31    2014
- 3、设置多个索引,以年和月份
df.set_index(['year', 'month'])
            sale
year  month
2012  1     55
2014  4     40
2013  7     84
2014  10    31
注:通过刚才的设置,这样DataFrame就变成了一个具有MultiIndex的DataFrame。
4.1.5 MultiIndex与Panel
打印刚才的df的行索引结果
df.index

MultiIndex(levels=[[1, 2], [1, 4, 7, 10]],
           labels=[[0, 0, 1, 1], [0, 1, 2, 3]],
           names=['year', 'month'])
4.1.5.1 MultiIndex
多级或分层索引对象。
- index属性
- names:levels的名称
- levels:每个level的元组值
df.index.names
FrozenList(['year', 'month'])

df.index.levels
FrozenList([[1, 2], [1, 4, 7, 10]])
4.1.5.2 Panel
- class
pandas.Panel(data=None, items=None, major_axis=None, minor_axis=None, copy=False, dtype=None)- 存储3维数组的Panel结构
p = pd.Panel(np.arange(24).reshape(4,3,2),
                 items=list('ABCD'),
                 major_axis=pd.date_range('20130101', periods=3),
                 minor_axis=['first', 'second'])
p

<class 'pandas.core.panel.Panel'>
Dimensions: 4 (items) x 3 (major_axis) x 2 (minor_axis)
Items axis: A to D
Major_axis axis: 2013-01-01 00:00:00 to 2013-01-03 00:00:00
Minor_axis axis: first to second
- items -
axis 0,每个项目对应于内部包含的数据帧(DataFrame)。 - major_axis -
axis 1,它是每个数据帧(DataFrame)的索引(行)。 - minor_axis -
axis 2,它是每个数据帧(DataFrame)的列。
注:Pandas从版本0.20.0开始弃用:推荐的用于表示3D数据的方法是通过DataFrame上的MultiIndex方法
如果获取DataFrame中某个股票的不同时间数据?这样的结构是什么样的?
4.1.6 Series结构
什么是Series结构呢,我们直接看下面的图:
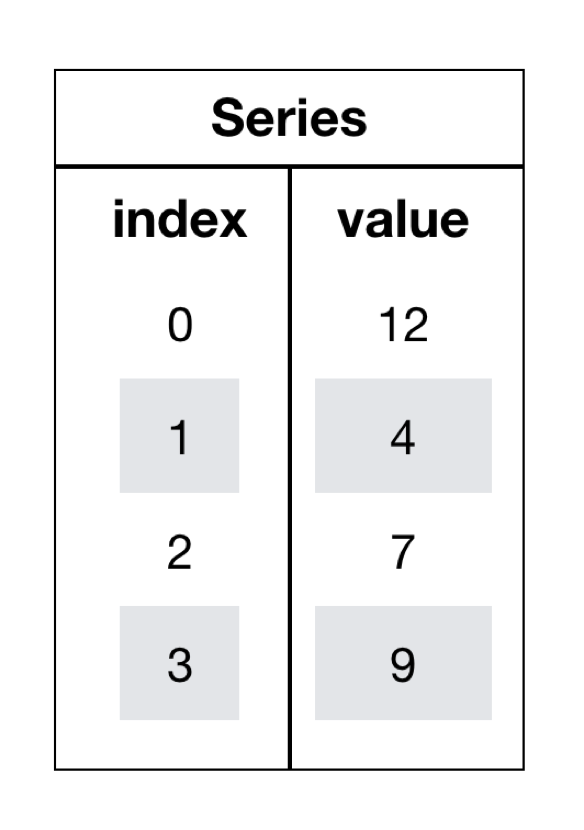
- series结构只有行索引
我们将之前的涨跌幅数据进行转置,然后获取'股票0'的所有数据
# series
type(data['股票0'])
pandas.core.series.Series

# 这一步相当于是series去获取行索引的值
data['股票0']['2017-01-02']
-0.18753158283513574
4.1.6.1 创建series
通过已有数据创建
- 指定内容,默认索引
pd.Series(np.arange(10))
- 指定索引
pd.Series([6.7,5.6,3,10,2], index=[1,2,3,4,5])
通过字典数据创建
pd.Series({'red':100, ''blue':200, 'green': 500, 'yellow':1000})
4.1.6.2 series获取属性和值
- index
- values
4.1.7、小结
- 说明pandas的三种数据结构